 |
Sensory Computer Systems Forums
Welcome to the Sensory Computer Systems Online Forums!
|
| View previous topic :: View next topic |
| Author |
Message |
ForumAdmin
Site Admin
Joined: May 20 2005
Posts: 120
Location: New Jersey
|
 Posted: Thu Mar 22, 2012 9:05 am Post subject: Two-Out-of-Five Posted: Thu Mar 22, 2012 9:05 am Post subject: Two-Out-of-Five |
 |
|
Year 2021, see our updated webpage --> https://www.sims2000.com/Questionnaire-2-out-of-5.asp
Older information and method is shown below.
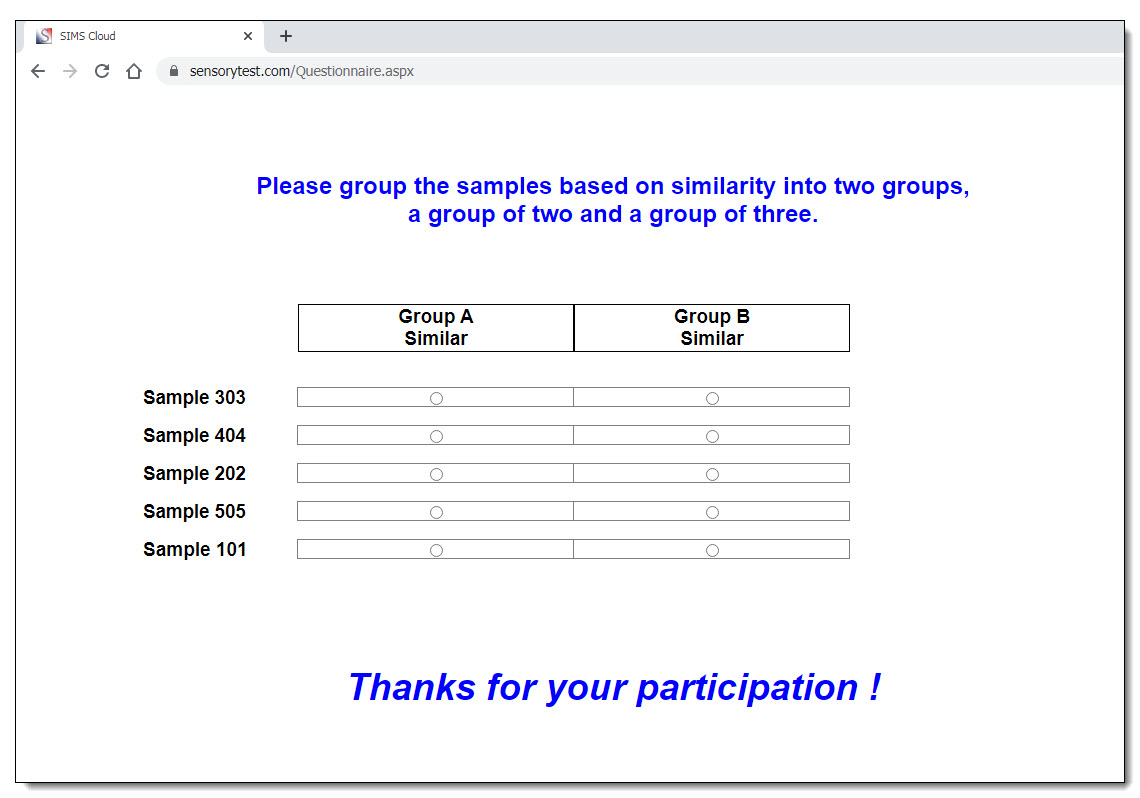
Two-Out-of-Five Test is a discrimination test presenting 5 products to the judge among which 2 are from one group and 3 are from another group. 2A 3B. Judges are asked to group the products into 2 groups usually based on similarity. Also known as a 2 Among 5 test, this test is used less often than the Triangle Test, Duo-Trio Test, or the paired-comparison tests.
Similar to a Two-Out-of-Four, aka Tetrad Test, a discrimination test presenting 4 products to the judge among which 2 are from one group and 2 are from another group. 2A 2B. See our webpage:
http://www.sims2000.com/Questionnaire-Tetrad.asp
Two-Out-of-Five test is generally not suitable for food products and flavors. Are you testing food or flavors?
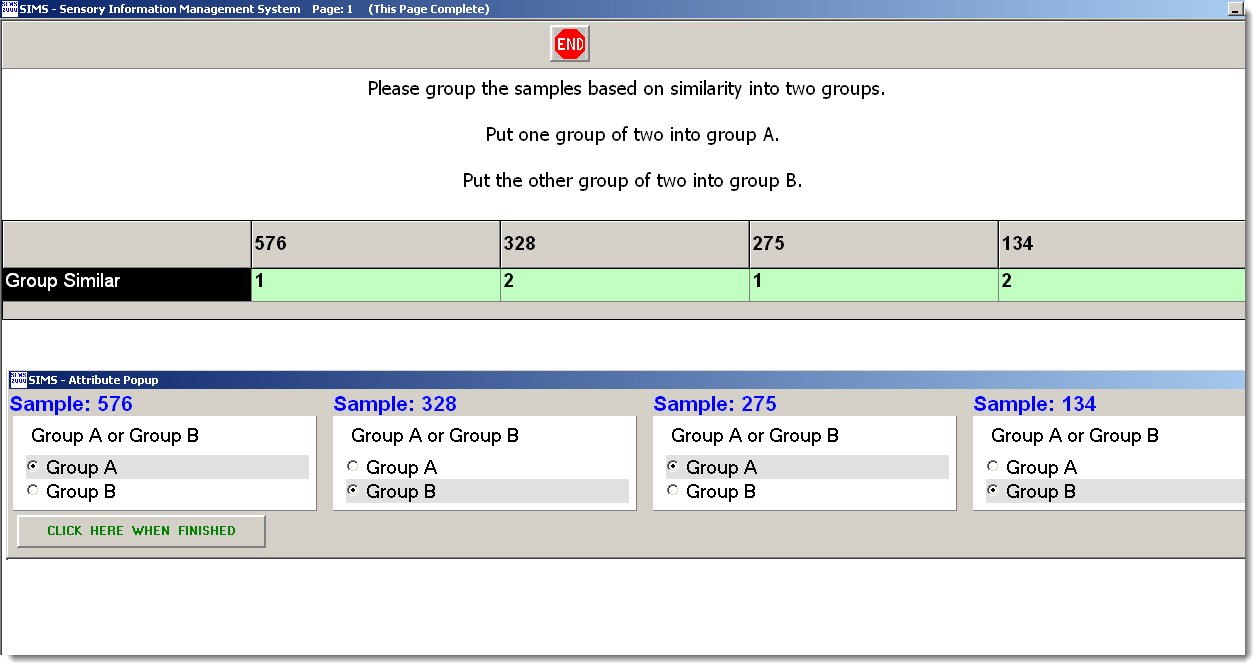
Questionnaire Example: 2 of 5 example, Tetrad same but with 4 samples. The sample's order will appear randomized.
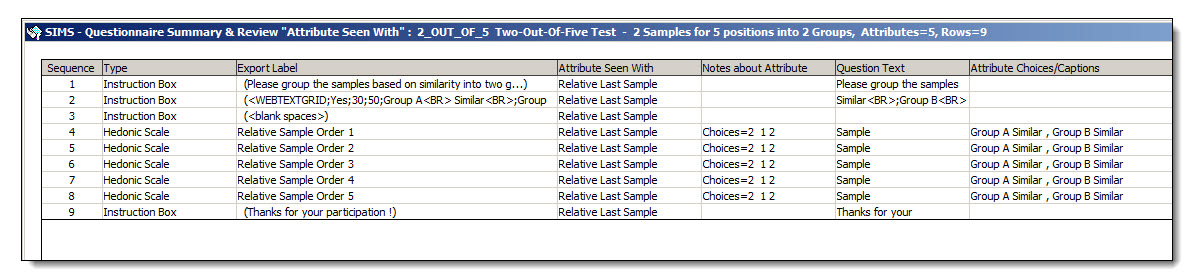
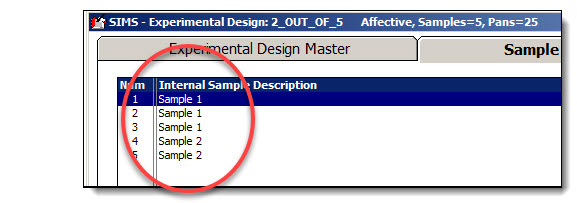
Experimental Design: Because this test is a little different than a typical discrimination test, the experimental design will also be a little different in setup. The ballot question as shown takes care of the presentation of your 2 actual samples. Setup a 5C5R1 experimental design, aka a five sample design, where each of these 5 is one of your 2 actual samples. Your Internal Sample DESCRIPTIONS must match 2 x 3 or 3 x 2
Pros & cons: Statistically robust, since the chances of guessing the 2/5 samples correctly is 1/10, rather than 1/3 as in the Triangle Test. Fewer panelists are often needed due to this boost in power as few as 5 or 6 panelists can be used when expected differences are large enough. But not a good choice when carry-over and lingering aftertastes is an issue due to the high number of samples that need to be tasted.
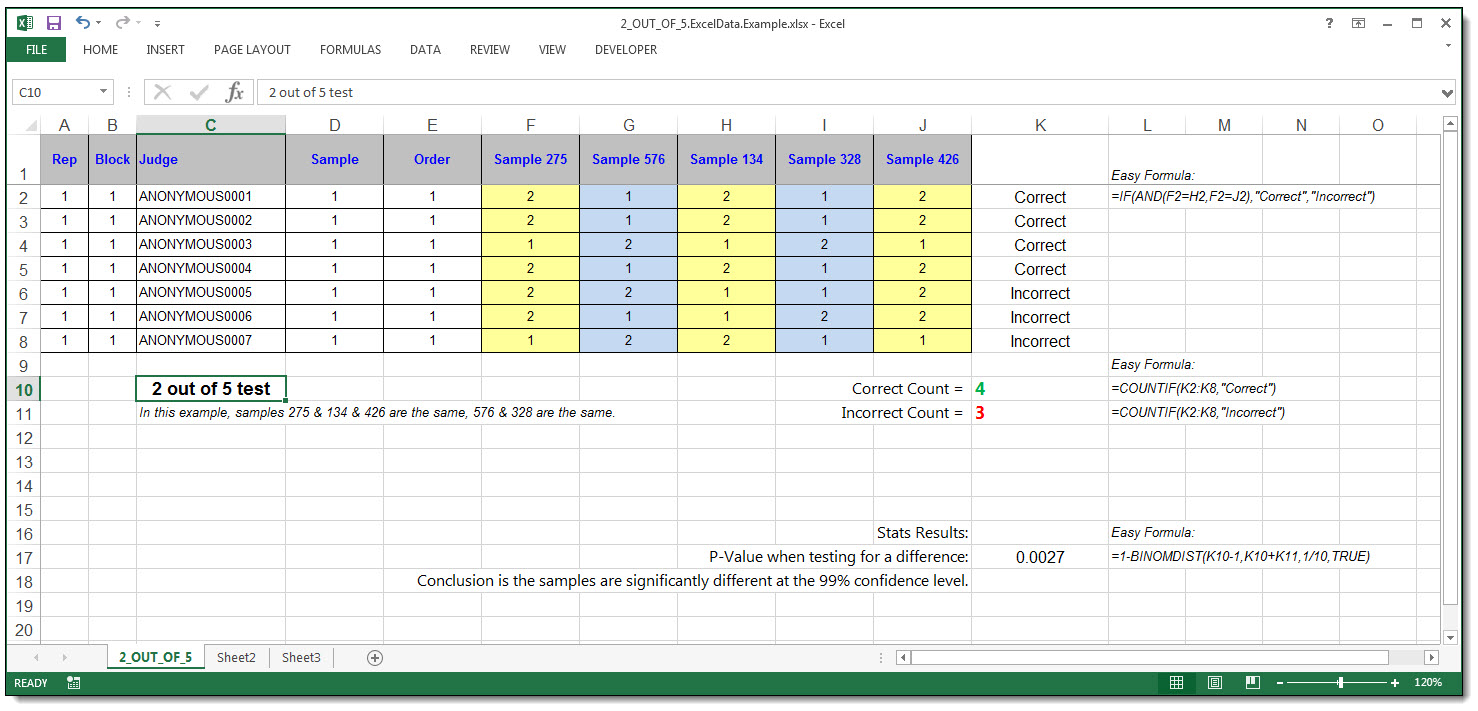
Raw Data: Use Data Export to Excel to count your Correct & Incorrect panelist responses.
Stats: Two-Out-of-Five Test In the partial chart below 'n' signifies the number of assessments in the test, and .1/.05 represents the a-risk, match the a-risk you want with the number of assessments you have performed to find the minimum number of correct responses needed to show significance. For example, for 20 assessments at an a-risk of 0.05, youd need 5 or more correct responses to show a significant difference.
| Code: | alpha
n 0.1 0.05 n 0.1 0.05 n 0.1 0.05 n 0.1 0.05
3 2 2 10 3 4 17 4 5 24 5 6
4 2 3 11 3 4 18 4 5 25 5 6
5 2 3 12 4 4 19 5 5 30 6 7
6 3 3 13 4 4 20 5 5 60 10 11
7 3 3 14 4 4 21 5 6
8 3 3 15 4 5 22 5 6
9 3 4 16 4 5 23 5 6 |
See complete statistical Table 17.14 Critical Number of Correct Responses in Two-out-of-Five Test,
Sensory Evaluation Techniques, 4th Edition, by Meilgaard, Civille, and Carr, page 439.
References:
Sensory Evaluation Techniques, Civille & Carr, 4th Edition, Chapter 6 Overall Difference Tests, page 80
More information:
https://www.sensorysociety.org/knowledge/sspwiki/Pages/Two-out-of-five%20Test.aspx
Last edited by ForumAdmin on Thu Apr 15, 2021 4:57 pm; edited 27 times in total |
|
| Back to top |
|
 |
ForumAdmin
Site Admin
Joined: May 20 2005
Posts: 120
Location: New Jersey
|
| Posted: Thu Jan 16, 2014 6:24 pm Post subject: Profiling |
|
|
Example using Profiling in SIMS.
NOTE: This profile style is less used then the ABOVE Hedonics shown in previous post above.
Use the Tetrad Examples in above post.
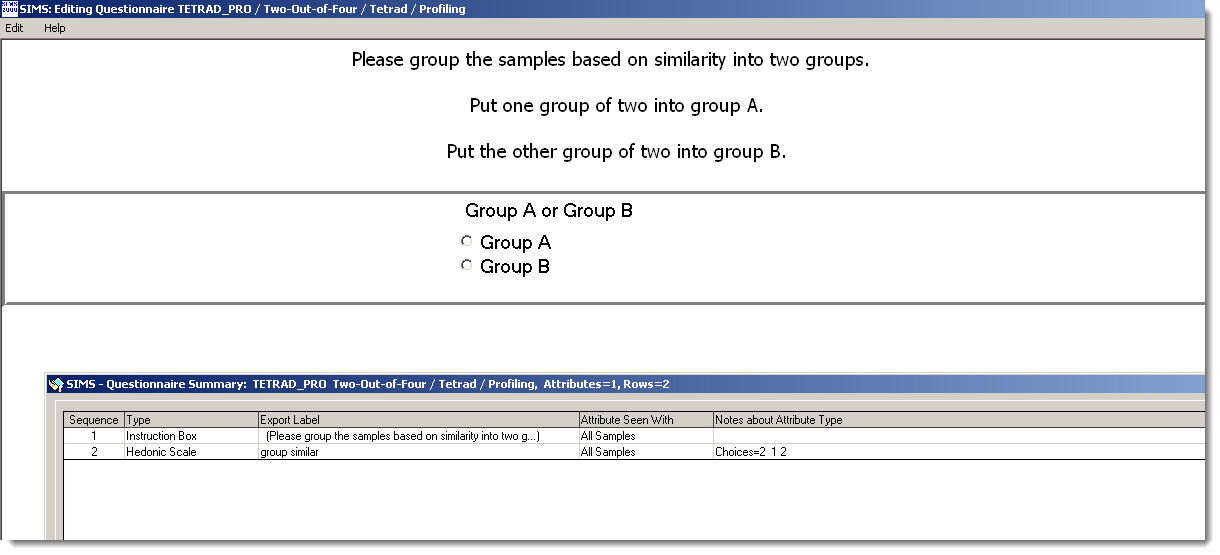
Questionnaire Example:
Profile Ballot Setup Example:
Profile style allows for unique blinding codes for all panelists, if that is an absolute requirement.
Experimental Design: Setup a 4C4R1 experimental design, a four sample design.
[X] Enable Profiling.
This design gives you more control over to customize the presentation order of the samples. A permutations plan is randomized.
Run the test, then use the SIMS software frequency reports to pull your data.
Raw Data: Use Data Export to Excel to count your Correct & Incorrect panelist responses. Use the same XLS file shown previous post above and transfer the responses accordingly.
Stats: Same as above. Tetrad, Two-Out-of-Four Test See complete statistical Table 17.8 Critical Number of Correct Responses in Triangle Test,
Sensory Evaluation Techniques, 4th Edition, by Meilgaard, Civille, and Carr, page 433.
|
|
| Back to top |
|
|
|
|
You cannot post new topics in this forum
You cannot reply to topics in this forum
You cannot edit your posts in this forum
You cannot delete your posts in this forum
You cannot vote in polls in this forum
|
Powered by phpBB © 2001, 2005 phpBB Group
|