PAL
Joined: Jun 01 2005
Posts: 24
|
 Posted: Thu Jun 23, 2005 3:26 pm Post subject: Q: Analyze multi-sample ranking or preference question? Posted: Thu Jun 23, 2005 3:26 pm Post subject: Q: Analyze multi-sample ranking or preference question? |
 |
|
Q. How do I analyze a multi-sample ranking or preference question?
Two samples == Paired Comparison == Binomial Analysis
Three or more samples == Ranking == Friedman Analysis
Three or more samples == Hedonic == Chi-Square Analysis
If you are comparing panelist preference between two samples, a Paired Comparison Discrimination attribute is the appropriate choice for your questionnaire. Binomial Analysis is the appropriate statistical method. Applicable for both Forced Choice and Non-Forced Choice. See SIMS 2000 reports Discrimination Paired Comparison Analysis and Statistics Analysis Report and Table Generation.
With three or more samples, a Ranking attribute records each panelist's ordered preferences for all samples seen. SIMS 2000 generates a nonparametric analysis using the Friedman Analysis. See SIMS 2000 Statistics Analysis Report and Table Generation.
SIMS 2000 advanced analysis reporting options provide Means, T statistics, P-Values, Significiance, and the Mean Separations. Improved reporting for Ranking Incomplete Blocks was added to SIMS 2000 during February 2008.
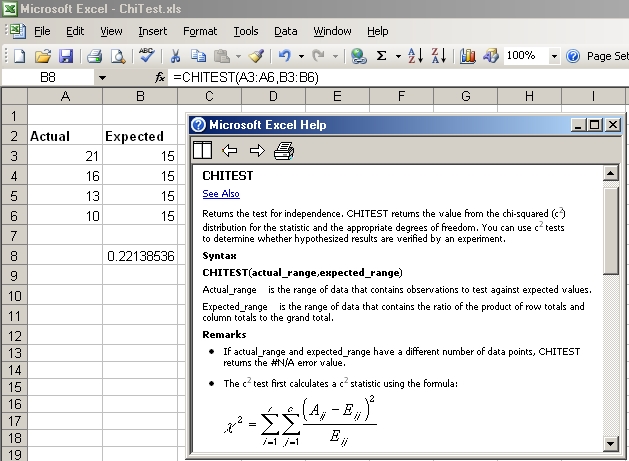
When you present three or more samples to the panelist, and simply ask him/her to choose the one sample that was preferred overall, an Hedonic attribute is appropriate choice for your questionnaire. Neither the Paired Comparison nor Friedman Test can be applied. In this case a Chi Square test is probably the simplest appropriate statistical method. This nonparametric test is available as a function in Excel spreadsheets. Run a SIMS 2000 Test Data Frequency Report to obtain the number of panelist responses that favored each of the samples presented. --- Each panelist must be presented with all possible samples, i.e., a Complete Block. Then compute the Expected Number of Responses for each sample. For example, if four samples are presented to a total of 60 panelists, each sample would be expected to be selected 15 times (60/4) if there were no difference between the samples. The sample Excel spreadsheet shown below illustrates how to compute the Chi Square statistic. In this case the results are not significant at the 5% level.
|
|